by Luca Gilli
In this previous post, we discussed how generative models could be used to help tackle machine learning problems affected by label imbalance. This post will cover another application of synthetic data for data augmentation. This time we will focus on how synthetic data can help tackle specific issues affecting datasets that can propagate to poor model performance.
Introduction
Machine Learning models can efficiently detect patterns within historical data, making them a practical choice for decision-making tools. Unfortunately, historical data is often affected by issues that can propagate into unacceptable model behavior. Such issues can arise, for example, because of the underrepresentation of certain labels or the presence of noise for certain data segments. Data augmentation corresponds to detecting and mitigating our dataset's issues by generating synthetic examples.
Step 1 - Data profiling
The first step towards effective data augmentation requires quantitatively identifying our dataset's specific problems. It is not a trivial task as most machine learning metrics, such as MSE or F-1 score, provide data scientists with a global picture of the situation, i.e. they are not very useful at highlighting model limitations concerning different data points.
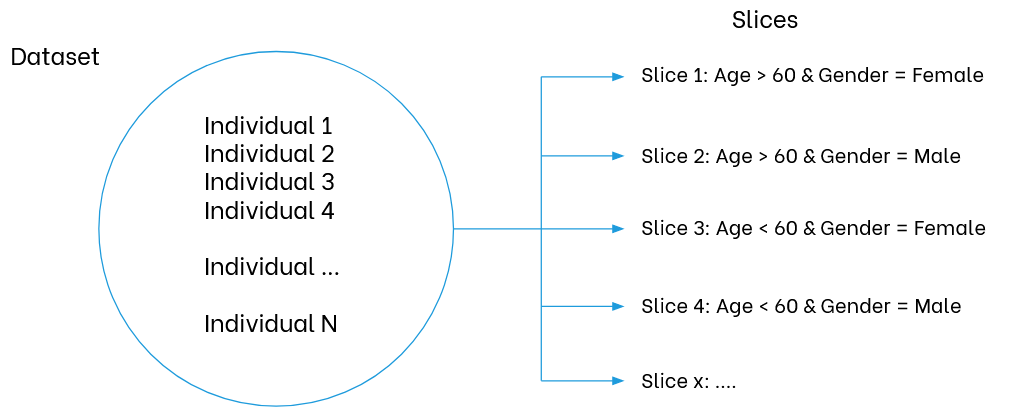
A good approach to highlight data issues reflecting a machine learning model performance is to start reasoning in terms of data slices. This corresponds to analyzing each metric for subgroups of points defined by certain rules or characteristics. These subgroups are usually defined as data slices. Data slices are data partitions obtained according to specific queries, as shown in the following Figure.
Performing such slicing and calculating metrics over each slice will give us a much more granular overview of our dataset's issues. Once we possess this information, we can augment our dataset by targeting specific data slices, making them less noisy or more represented within the whole dataset.
An example
To better understand the concepts introduced so far, let's look at a practical example of detecting and mitigating data issues using synthetic data. We will use a binary classification dataset used in the marketing domain to predict churn rates. The task is to predict whether an individual will terminate a subscription based on their characteristics. It's a mixed-type dataset as it includes both numerical and categorical variables.
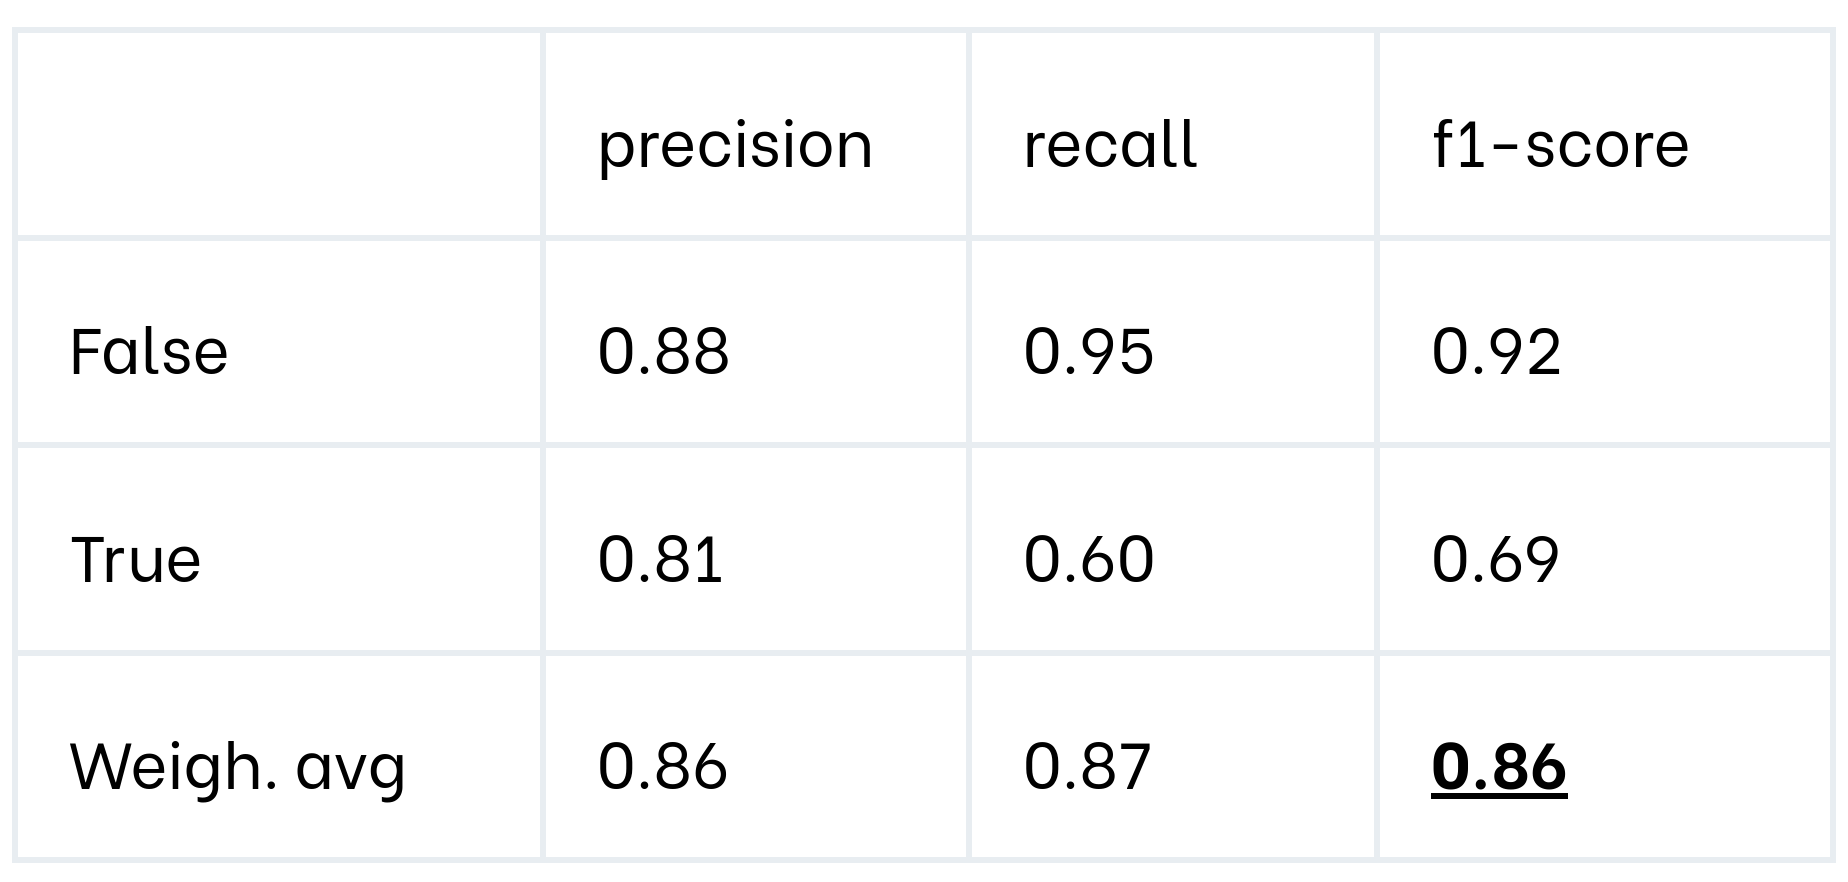
To set up this example, we trained an XGBoost classifier. We first analyze model performance on the whole dataset, calculating a classification report. The next table shows the metrics achieved on hold-out test data.
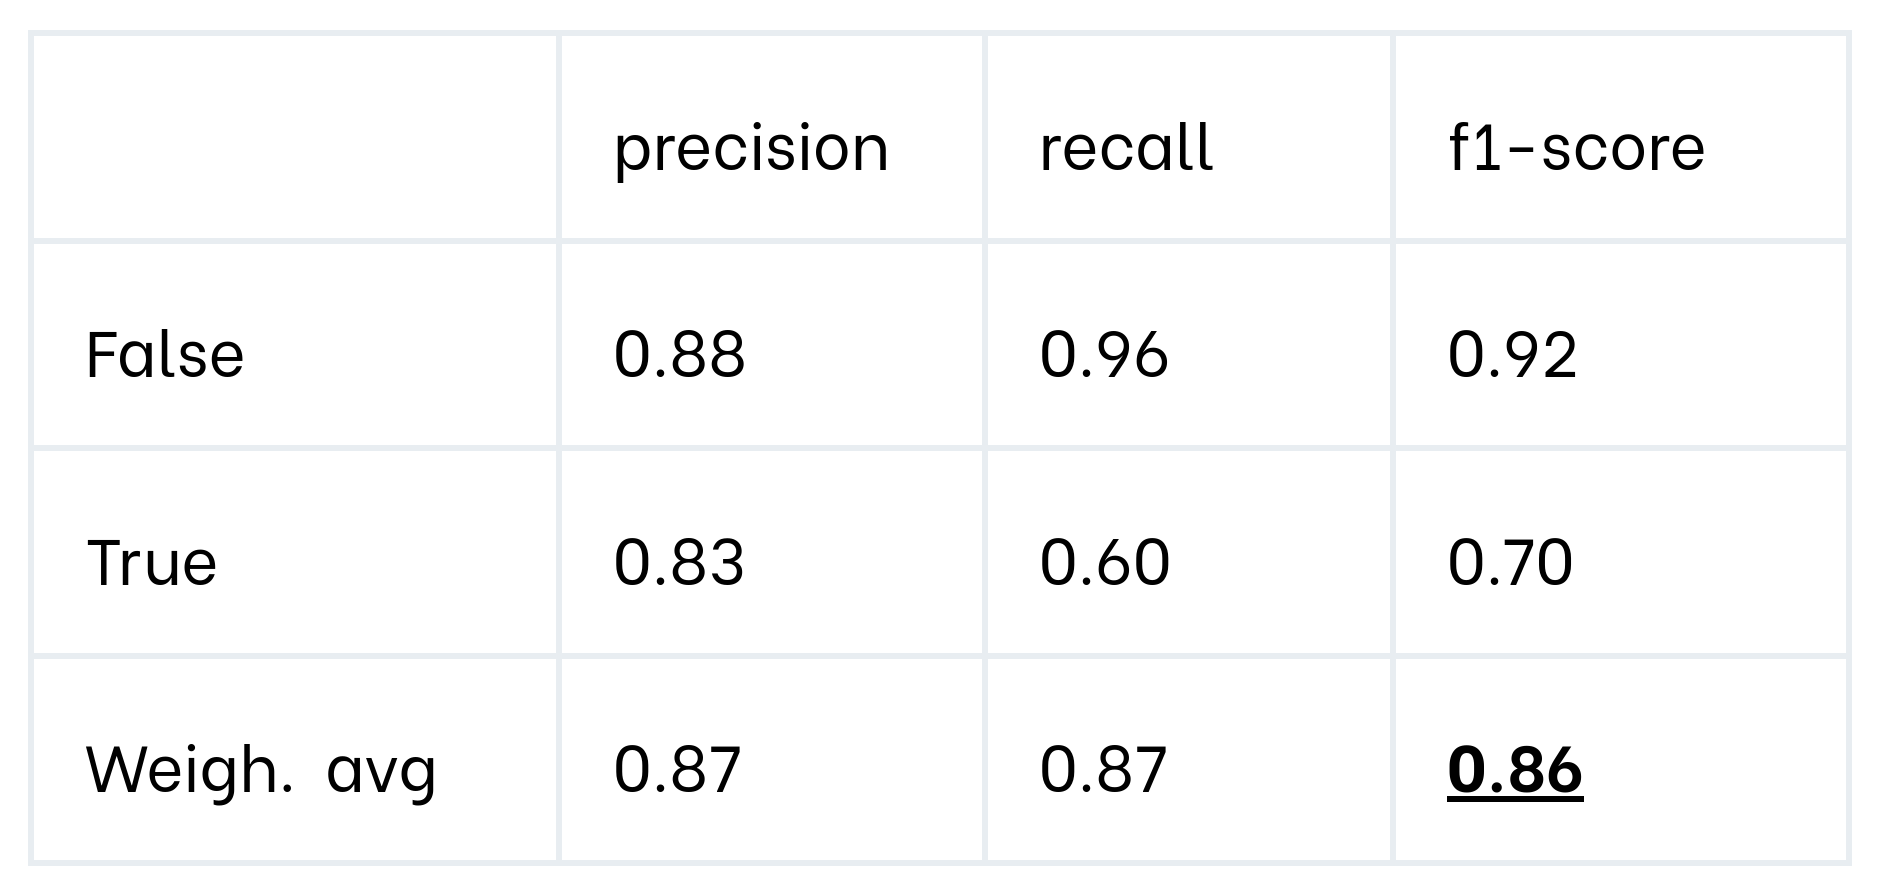
On the surface, the global metrics appear to be already fairly OK. However, we want to dig deeper into the dataset by analyzing the model performance on several data slices.
We used the slicing tool from Clearbox AI's Structured Data Profiling library to do so. The tool can be automatically used to generate data slices that contain protected attributes. These slices are defined as SQL-like queries. We then calculated the fractions of positive predictions and the True Positive Rates for each slice, as shown in the next figure.
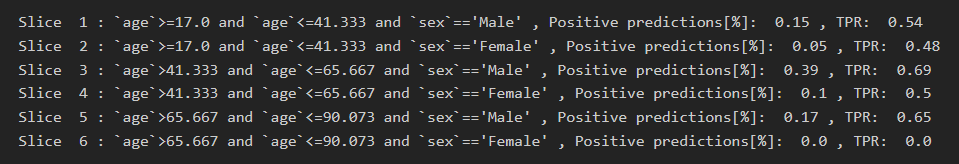
As seen from these slices, the model performs poorly on some data slices describing certain types of individuals. For example, we can see that the model never assigns positive predictions to women older than 65, even when it should. It means that we identified a potential model limitation. With this information, we could either decide not to use the model for certain data slices or try to investigate whether data augmentation could come to our help.
Step 2 - Mitigating data issues with synthetic data
We want to mitigate this aspect while still using the dataset. In this case, we can use synthetic data to inject our own bias into the dataset.
We can create additional examples of older women canceling their subscriptions to mitigate the fact that the model did not learn to make good predictions on this data slice.
The operation corresponds to creating synthetic examples associated with a positive label for the data slices 4 and 6. We did so using our synthetic data engine, which allowed us to create new realistic data points for the slices in question.
We then re-trained a new XGBoost model using the augmented dataset, containing the original data and the new examples. We tested this model on a hold-out dataset to ensure the bias metrics improved, as shown in the following tables.

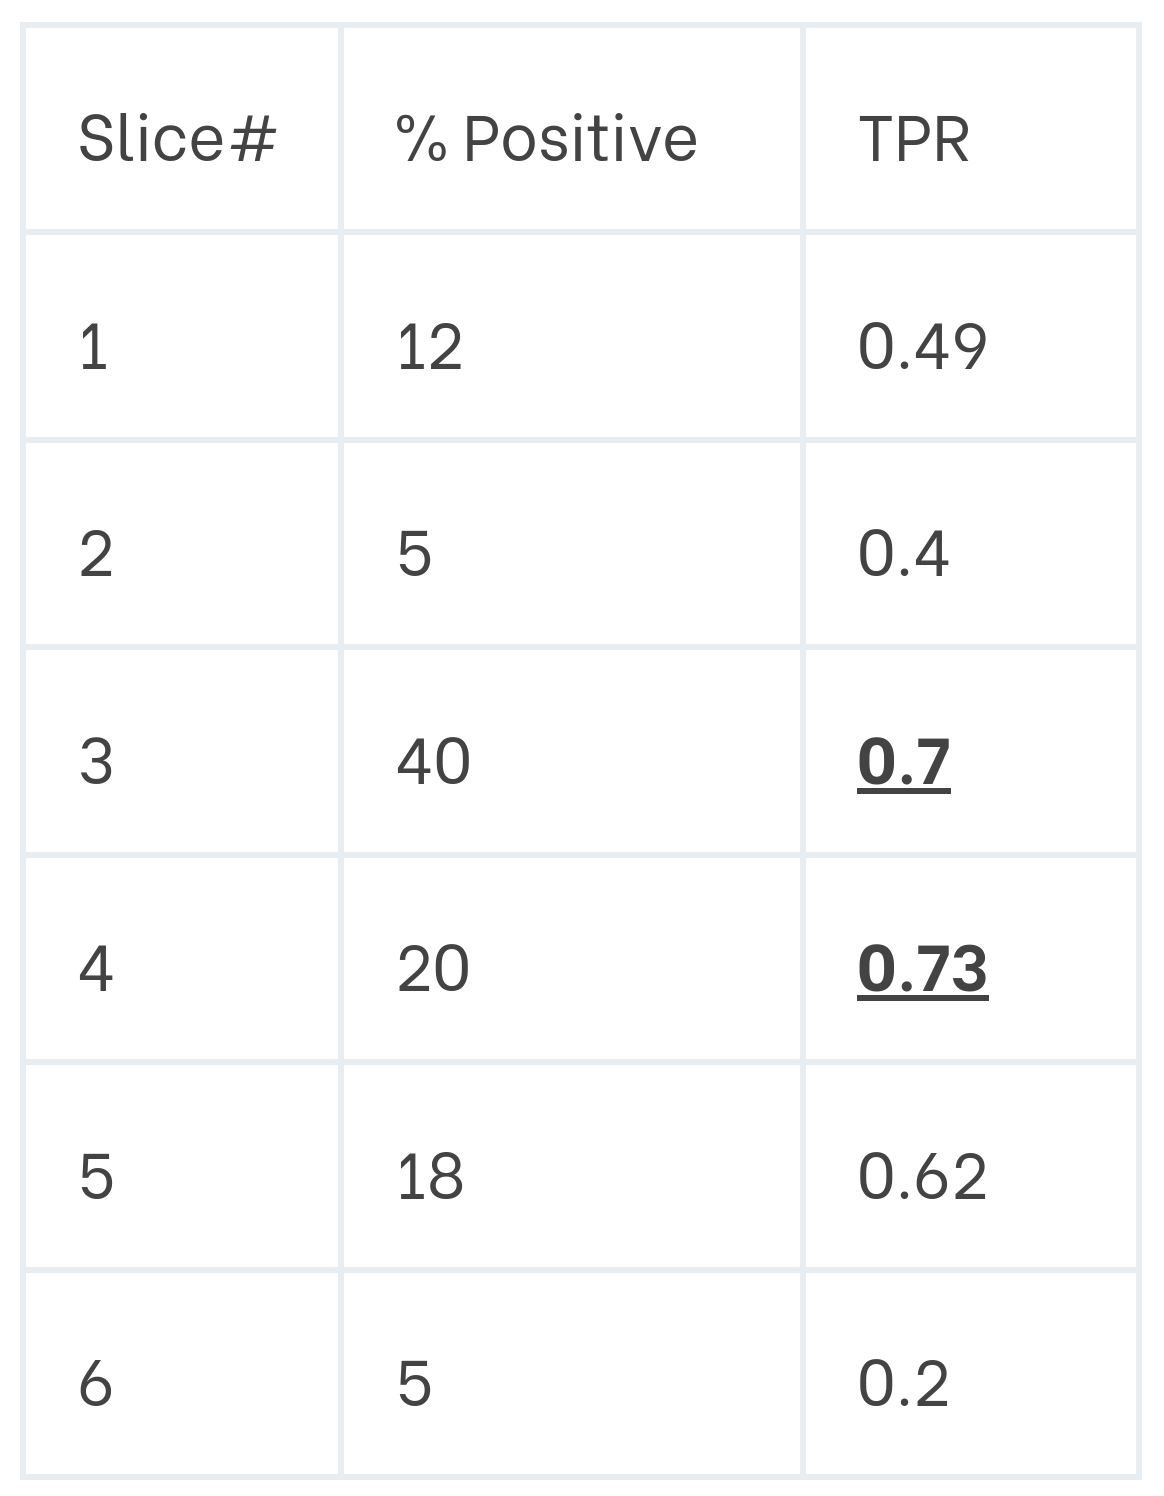
The tables show that the model trained on the augmented data presented better metrics for the problematic slices. The model now makes positive predictions for women older than 65, and the TPR for middle-aged women is comparable to the TPR for middle-aged men. We can conclude that synthetic examples effectively mitigate a specific issue affecting our data.
The next question is, however, how the model performs on hold-out data, which is more representative of production data. Unfortunately, similar problems will likely affect this data, and the question is whether an augmented model will achieve decent performance.
The next table shows the classification metrics obtained by the improved model on untouched hold-out data.
Luckily the new model achieves similar metrics on the hold-out dataset. This means we managed to improve model performances on problematic data slices while maintaining the same global performance.
Step 3 - Synthetic data performance trade-off
Augmenting datasets is not a trivial task and usually corresponds to finding the ideal trade-off between local and global performance. However, we believe that synthetic data can be a great instrument in the hands of data scientists striving for better models!